




















































Personal finance, made readable.
Challenge
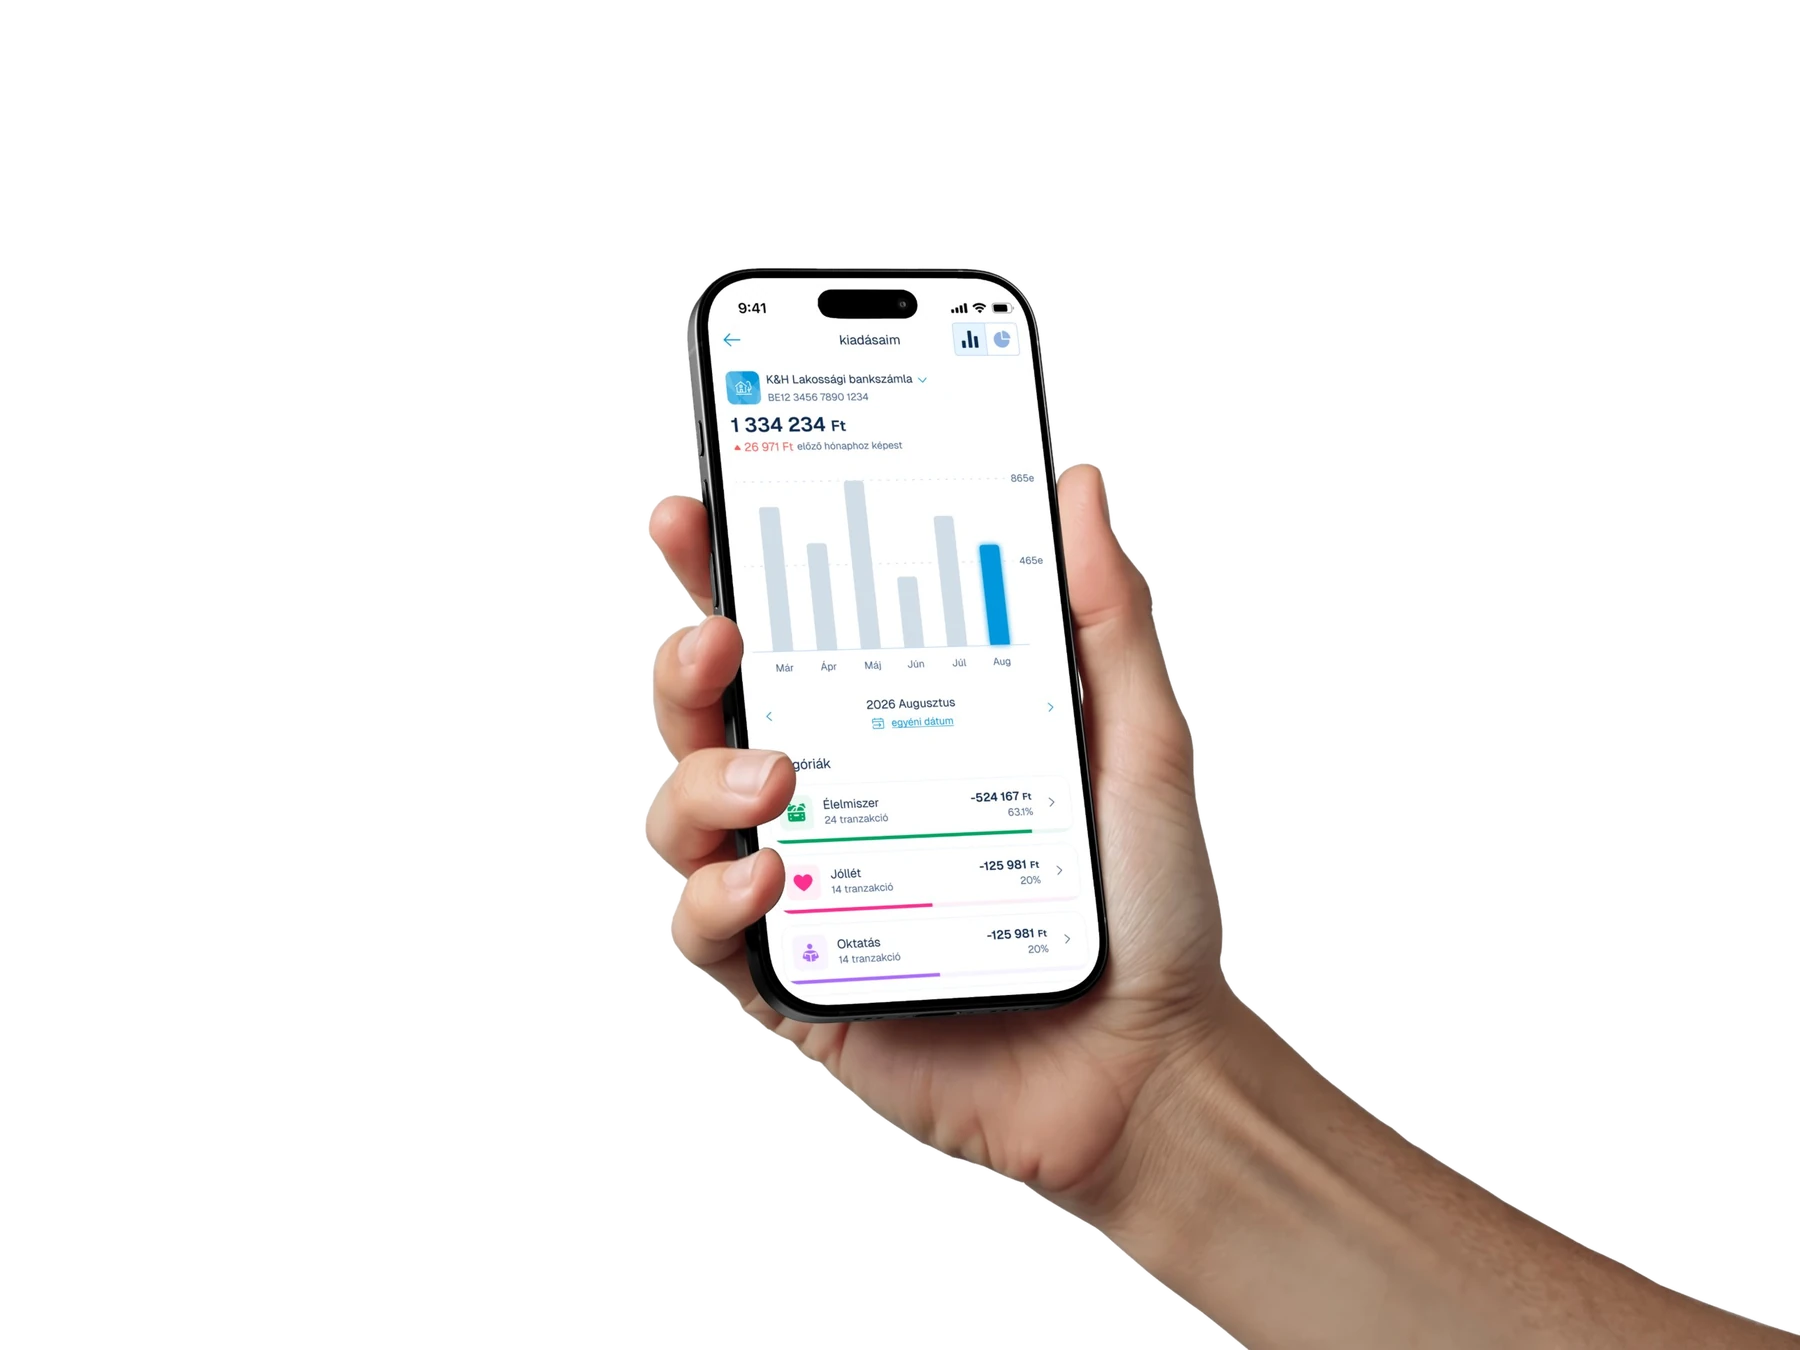
K&H customers could see every transaction, but not what their month added up to. Spending lived in a long, flat list, so simple questions — where did the money go, is this month worse than the last — took scrolling and mental math. We needed to make the numbers readable at a glance without turning the banking app into a budgeting tool nobody asked for.
Solution
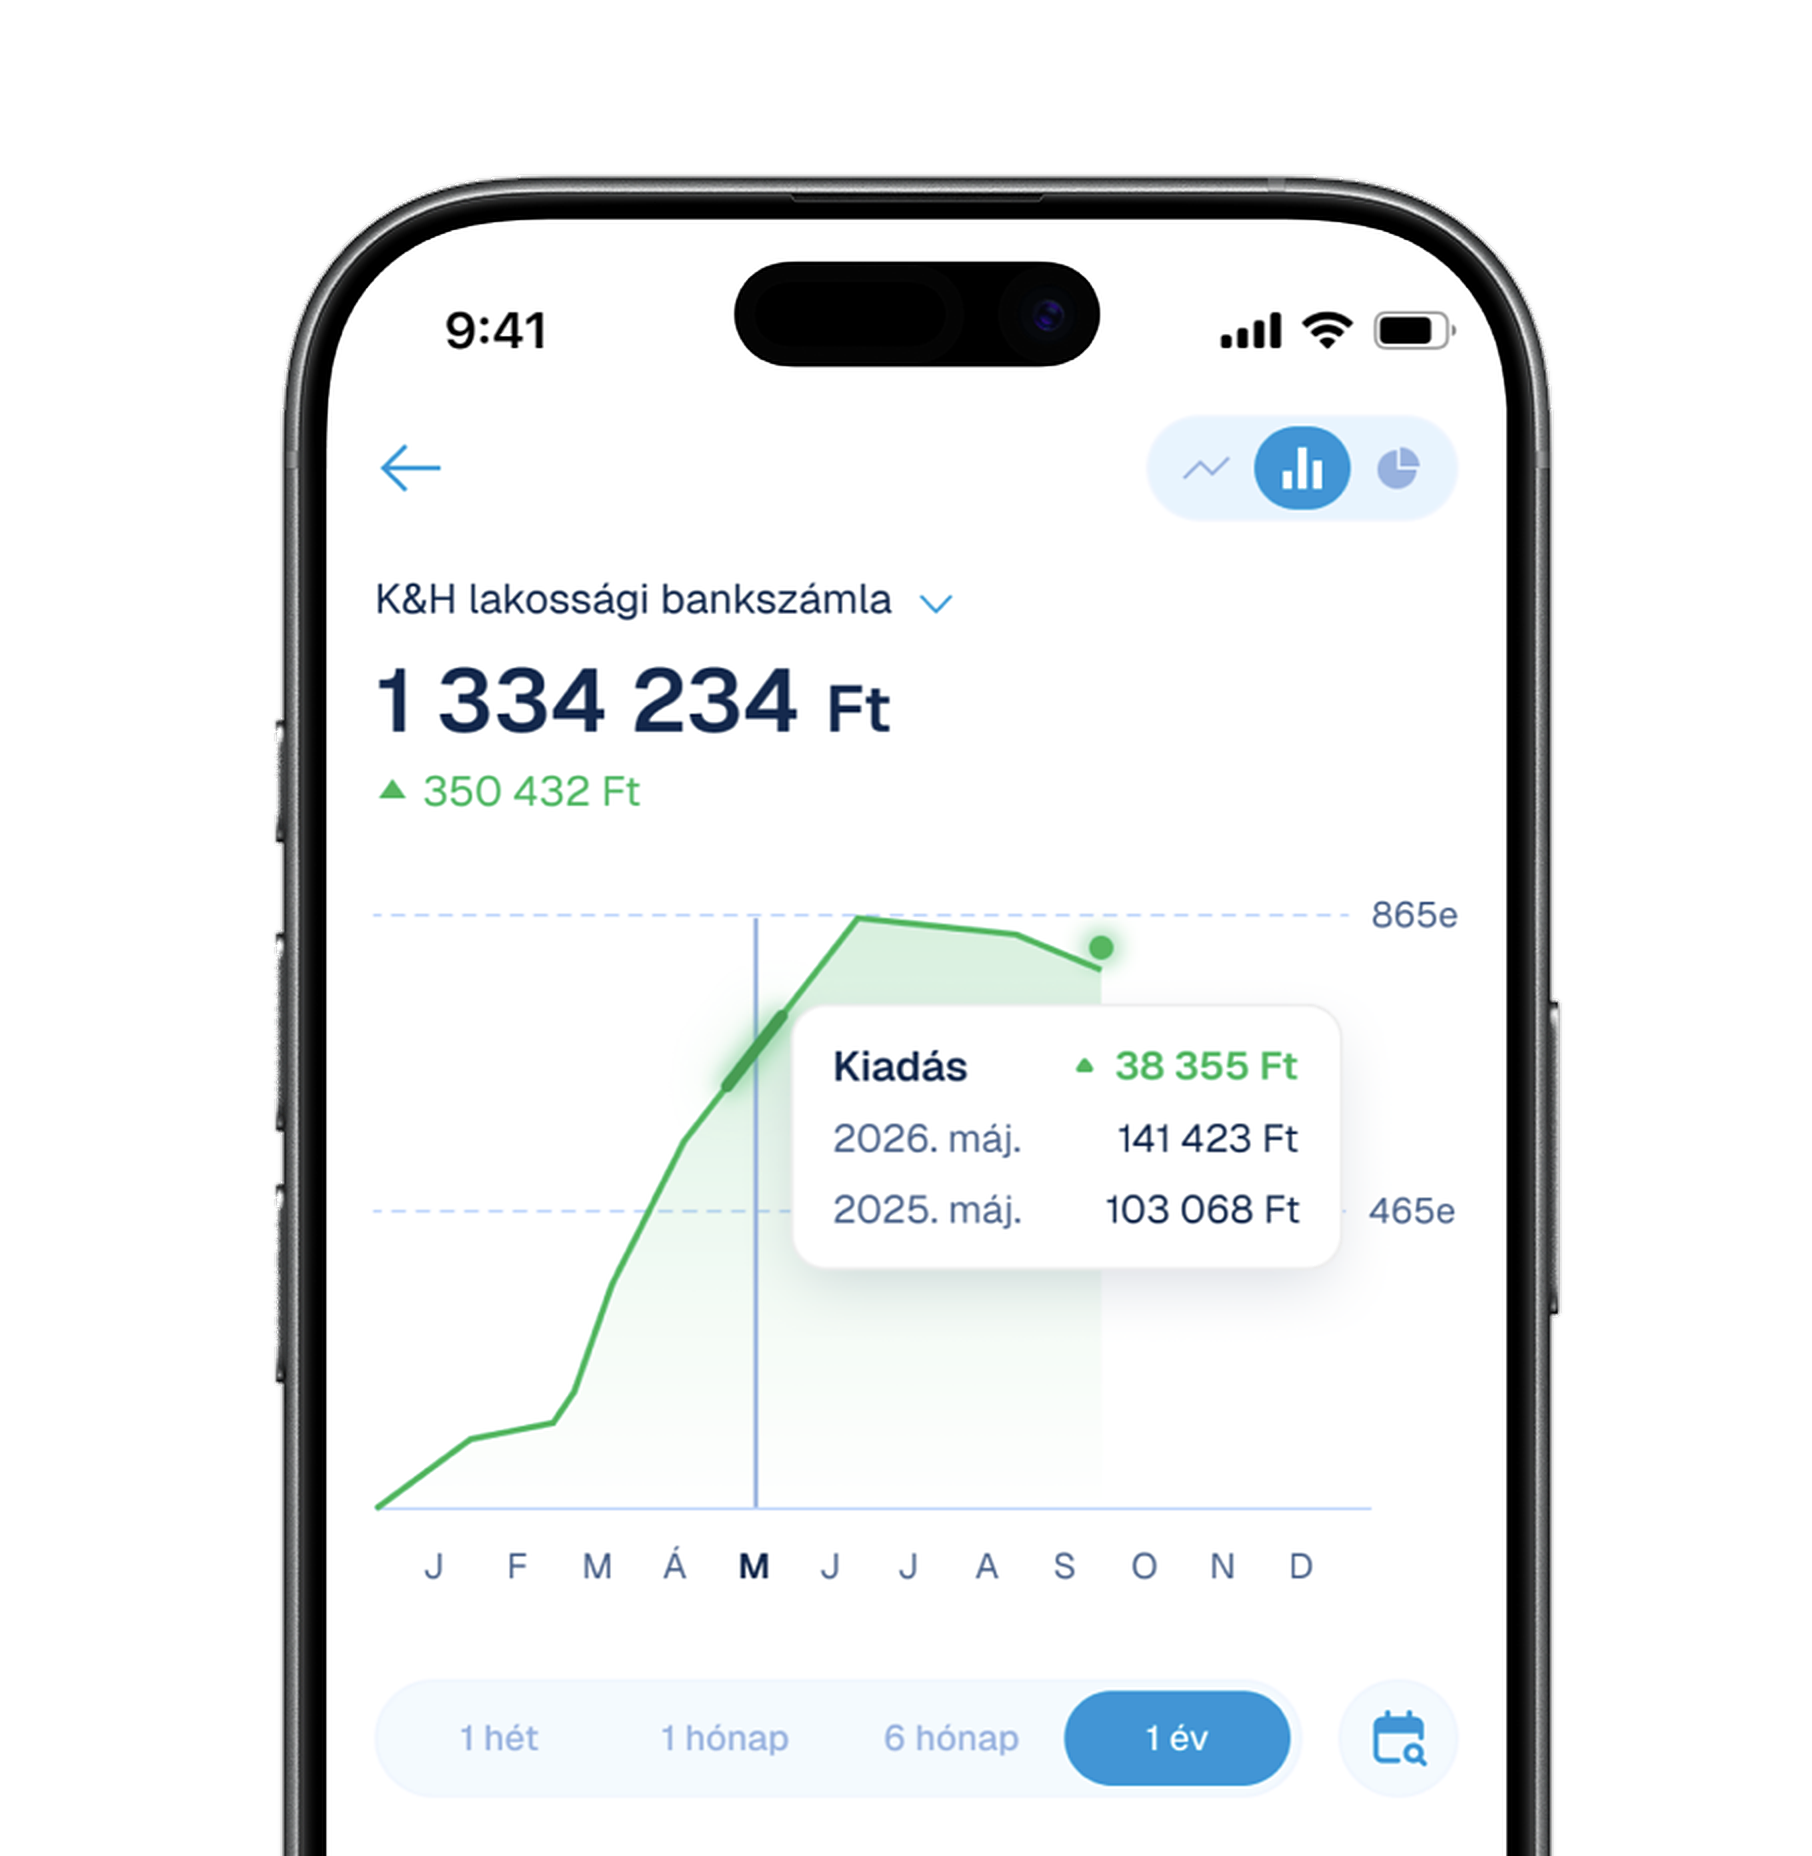
A spending view that leads with one number and one comparison: the month's total and how it moved against the previous one. Below it, a six-month chart sets the context, and every transaction is sorted into fifteen colour-coded categories, each with its share of the month and a progress bar. The colour of a category stays the same everywhere it appears, so it becomes a shorthand the user learns once.